New: Quorum and Axios Partnership — Bring the hyper-relevant industry news from Axios Pro into your legislative tracking workflow.

Learn More
WP_Query Object ( [query] => Array ( [name] => state-legislatures-versus-congress-which-is-more-productive [post_type] => resources [resource-type] => data-driven-insights ) [query_vars] => Array ( [name] => state-legislatures-versus-congress-which-is-more-productive [post_type] => resources [resource-type] => data-driven-insights [error] => [m] => [p] => 0 [post_parent] => [subpost] => [subpost_id] => [attachment] => [attachment_id] => 0 [pagename] => [page_id] => 0 [second] => [minute] => [hour] => [day] => 0 [monthnum] => 0 [year] => 0 [w] => 0 [category_name] => [tag] => [cat] => [tag_id] => [author] => [author_name] => [feed] => [tb] => [paged] => 0 [meta_key] => [meta_value] => [preview] => [s] => [sentence] => [title] => [fields] => [menu_order] => [embed] => [category__in] => Array ( ) [category__not_in] => Array ( ) [category__and] => Array ( ) [post__in] => Array ( ) [post__not_in] => Array ( ) [post_name__in] => Array ( ) [tag__in] => Array ( ) [tag__not_in] => Array ( ) [tag__and] => Array ( ) [tag_slug__in] => Array ( ) [tag_slug__and] => Array ( ) [post_parent__in] => Array ( ) [post_parent__not_in] => Array ( ) [author__in] => Array ( ) [author__not_in] => Array ( ) [search_columns] => Array ( ) [ignore_sticky_posts] => [suppress_filters] => [cache_results] => 1 [update_post_term_cache] => 1 [update_menu_item_cache] => [lazy_load_term_meta] => 1 [update_post_meta_cache] => 1 [posts_per_page] => 10 [nopaging] => [comments_per_page] => 50 [no_found_rows] => [order] => DESC ) [tax_query] => [meta_query] => WP_Meta_Query Object ( [queries] => Array ( ) [relation] => [meta_table] => [meta_id_column] => [primary_table] => [primary_id_column] => [table_aliases:protected] => Array ( ) [clauses:protected] => Array ( ) [has_or_relation:protected] => ) [date_query] => [queried_object] => WP_Post Object ( [ID] => 1658 [post_author] => 1 [post_date] => 2016-06-30 00:00:00 [post_date_gmt] => 2016-06-30 00:00:00 [post_content] => Using Quorum States, we discovered that state legislatures introduce 23 times more bills than Congress does, totaling an average 128,145 bills per year and 3.1 million words per day in session.

States Introduce More Legislation Than The U.S. Congress

Legislation moves faster and is passed at higher frequencies at the state level than the federal level. In fact, state legislatures introduce 23 times the number of bills than the U.S. Congress does, totaling an average 128,145 bills per year and 3.1 million words per day while in session. With this in mind, it is extremely necessary to track legislation as best as possible. With the first half of 2016 complete, we found how this year’s state legislation has compared to previous years. Between January 1, 2016 and June 30, 2016, state legislatures introduced a total of 63,018 bills. The 10 states below introduced the greatest amount of legislation during these six months. Data on legislation introduction. It’s important to note that state legislatures in Montana, Nevada, North Dakota, and Texas did not hold regular sessions in 2016. In 2015, the Texas state legislature introduced 5,517 bills, accounting for 7.5% of state bills introduced between January and June.

Legislation at the state level is more likely to be enacted than federal legislation.

19.3% of state Senate bills and 13.3% of state House bills are enacted on average compared with 3.6% and 1.9% of US Senate and House bills respectively. The number of bills introduced by state. Legislation at the state level is more likely to be enacted than at the federal.

The Arkansas state legislature led in the percentage of enacted legislation.

During the first six months of 2016, 8,295 bills were enacted at the state level, which was 24% of the bills introduced across state legislatures. Arkansas led the way, enacting 94% of the bills introduced in its 2016 Fiscal Session. These 10 states enacted the highest percentage of legislation in the first six months of 2016: 1: Arkansas - 94% 2: South Dakota - 56% 3: Colorado - 55% 4: Utah - 52% 5: Wyoming - 44% 6: Oregon - 40% 7: Nebraska - 38% 8: Tennessee - 37% 9: Virginia - 35% 10: Idaho - 31% [post_title] => State Legislatures Vs. Congress: Which Is More Productive? [post_excerpt] => [post_status] => publish [comment_status] => closed [ping_status] => closed [post_password] => [post_name] => state-legislatures-versus-congress-which-is-more-productive [to_ping] => [pinged] => [post_modified] => 2021-11-17 15:52:11 [post_modified_gmt] => 2021-11-17 15:52:11 [post_content_filtered] => [post_parent] => 0 [guid] => https://marketing-staging.quorum.us/resources/state-legislatures-versus-congress-which-is-more-productive/ [menu_order] => 0 [post_type] => resources [post_mime_type] => [comment_count] => 0 [filter] => raw ) [queried_object_id] => 1658 [request] => SELECT wp_posts.* FROM wp_posts WHERE 1=1 AND wp_posts.post_name = 'state-legislatures-versus-congress-which-is-more-productive' AND wp_posts.post_type = 'resources' ORDER BY wp_posts.post_date DESC [posts] => Array ( [0] => WP_Post Object ( [ID] => 1658 [post_author] => 1 [post_date] => 2016-06-30 00:00:00 [post_date_gmt] => 2016-06-30 00:00:00 [post_content] => Using Quorum States, we discovered that state legislatures introduce 23 times more bills than Congress does, totaling an average 128,145 bills per year and 3.1 million words per day in session.

States Introduce More Legislation Than The U.S. Congress

Legislation moves faster and is passed at higher frequencies at the state level than the federal level. In fact, state legislatures introduce 23 times the number of bills than the U.S. Congress does, totaling an average 128,145 bills per year and 3.1 million words per day while in session. With this in mind, it is extremely necessary to track legislation as best as possible. With the first half of 2016 complete, we found how this year’s state legislation has compared to previous years. Between January 1, 2016 and June 30, 2016, state legislatures introduced a total of 63,018 bills. The 10 states below introduced the greatest amount of legislation during these six months. Data on legislation introduction. It’s important to note that state legislatures in Montana, Nevada, North Dakota, and Texas did not hold regular sessions in 2016. In 2015, the Texas state legislature introduced 5,517 bills, accounting for 7.5% of state bills introduced between January and June.

Legislation at the state level is more likely to be enacted than federal legislation.

19.3% of state Senate bills and 13.3% of state House bills are enacted on average compared with 3.6% and 1.9% of US Senate and House bills respectively. The number of bills introduced by state. Legislation at the state level is more likely to be enacted than at the federal.

The Arkansas state legislature led in the percentage of enacted legislation.

During the first six months of 2016, 8,295 bills were enacted at the state level, which was 24% of the bills introduced across state legislatures. Arkansas led the way, enacting 94% of the bills introduced in its 2016 Fiscal Session. These 10 states enacted the highest percentage of legislation in the first six months of 2016: 1: Arkansas - 94% 2: South Dakota - 56% 3: Colorado - 55% 4: Utah - 52% 5: Wyoming - 44% 6: Oregon - 40% 7: Nebraska - 38% 8: Tennessee - 37% 9: Virginia - 35% 10: Idaho - 31% [post_title] => State Legislatures Vs. Congress: Which Is More Productive? [post_excerpt] => [post_status] => publish [comment_status] => closed [ping_status] => closed [post_password] => [post_name] => state-legislatures-versus-congress-which-is-more-productive [to_ping] => [pinged] => [post_modified] => 2021-11-17 15:52:11 [post_modified_gmt] => 2021-11-17 15:52:11 [post_content_filtered] => [post_parent] => 0 [guid] => https://marketing-staging.quorum.us/resources/state-legislatures-versus-congress-which-is-more-productive/ [menu_order] => 0 [post_type] => resources [post_mime_type] => [comment_count] => 0 [filter] => raw ) ) [post_count] => 1 [current_post] => -1 [before_loop] => 1 [in_the_loop] => [post] => WP_Post Object ( [ID] => 1658 [post_author] => 1 [post_date] => 2016-06-30 00:00:00 [post_date_gmt] => 2016-06-30 00:00:00 [post_content] => Using Quorum States, we discovered that state legislatures introduce 23 times more bills than Congress does, totaling an average 128,145 bills per year and 3.1 million words per day in session.

States Introduce More Legislation Than The U.S. Congress

Legislation moves faster and is passed at higher frequencies at the state level than the federal level. In fact, state legislatures introduce 23 times the number of bills than the U.S. Congress does, totaling an average 128,145 bills per year and 3.1 million words per day while in session. With this in mind, it is extremely necessary to track legislation as best as possible. With the first half of 2016 complete, we found how this year’s state legislation has compared to previous years. Between January 1, 2016 and June 30, 2016, state legislatures introduced a total of 63,018 bills. The 10 states below introduced the greatest amount of legislation during these six months. Data on legislation introduction. It’s important to note that state legislatures in Montana, Nevada, North Dakota, and Texas did not hold regular sessions in 2016. In 2015, the Texas state legislature introduced 5,517 bills, accounting for 7.5% of state bills introduced between January and June.

Legislation at the state level is more likely to be enacted than federal legislation.

19.3% of state Senate bills and 13.3% of state House bills are enacted on average compared with 3.6% and 1.9% of US Senate and House bills respectively. The number of bills introduced by state. Legislation at the state level is more likely to be enacted than at the federal.

The Arkansas state legislature led in the percentage of enacted legislation.

During the first six months of 2016, 8,295 bills were enacted at the state level, which was 24% of the bills introduced across state legislatures. Arkansas led the way, enacting 94% of the bills introduced in its 2016 Fiscal Session. These 10 states enacted the highest percentage of legislation in the first six months of 2016: 1: Arkansas - 94% 2: South Dakota - 56% 3: Colorado - 55% 4: Utah - 52% 5: Wyoming - 44% 6: Oregon - 40% 7: Nebraska - 38% 8: Tennessee - 37% 9: Virginia - 35% 10: Idaho - 31% [post_title] => State Legislatures Vs. Congress: Which Is More Productive? [post_excerpt] => [post_status] => publish [comment_status] => closed [ping_status] => closed [post_password] => [post_name] => state-legislatures-versus-congress-which-is-more-productive [to_ping] => [pinged] => [post_modified] => 2021-11-17 15:52:11 [post_modified_gmt] => 2021-11-17 15:52:11 [post_content_filtered] => [post_parent] => 0 [guid] => https://marketing-staging.quorum.us/resources/state-legislatures-versus-congress-which-is-more-productive/ [menu_order] => 0 [post_type] => resources [post_mime_type] => [comment_count] => 0 [filter] => raw ) [comment_count] => 0 [current_comment] => -1 [found_posts] => 1 [max_num_pages] => 0 [max_num_comment_pages] => 0 [is_single] => 1 [is_preview] => [is_page] => [is_archive] => [is_date] => [is_year] => [is_month] => [is_day] => [is_time] => [is_author] => [is_category] => [is_tag] => [is_tax] => [is_search] => [is_feed] => [is_comment_feed] => [is_trackback] => [is_home] => [is_privacy_policy] => [is_404] => [is_embed] => [is_paged] => [is_admin] => [is_attachment] => [is_singular] => 1 [is_robots] => [is_favicon] => [is_posts_page] => [is_post_type_archive] => [query_vars_hash:WP_Query:private] => 2fa19f001837378b4f742ea23c66b924 [query_vars_changed:WP_Query:private] => [thumbnails_cached] => [allow_query_attachment_by_filename:protected] => [stopwords:WP_Query:private] => [compat_fields:WP_Query:private] => Array ( [0] => query_vars_hash [1] => query_vars_changed ) [compat_methods:WP_Query:private] => Array ( [0] => init_query_flags [1] => parse_tax_query ) )
!!! 1658
Data Driven Insights

State Legislatures Vs. Congress: Which Is More Productive?

State Legislatures Vs. Congress: Which Is More Productive?

Using Quorum States, we discovered that state legislatures introduce 23 times more bills than Congress does, totaling an average 128,145 bills per year and 3.1 million words per day in session.

States Introduce More Legislation Than The U.S. Congress

Legislation moves faster and is passed at higher frequencies at the state level than the federal level. In fact, state legislatures introduce 23 times the number of bills than the U.S. Congress does, totaling an average 128,145 bills per year and 3.1 million words per day while in session. With this in mind, it is extremely necessary to track legislation as best as possible.

With the first half of 2016 complete, we found how this year’s state legislation has compared to previous years.

Between January 1, 2016 and June 30, 2016, state legislatures introduced a total of 63,018 bills. The 10 states below introduced the greatest amount of legislation during these six months.

Data on legislation introduction.

It’s important to note that state legislatures in Montana, Nevada, North Dakota, and Texas did not hold regular sessions in 2016. In 2015, the Texas state legislature introduced 5,517 bills, accounting for 7.5% of state bills introduced between January and June.

Legislation at the state level is more likely to be enacted than federal legislation.

19.3% of state Senate bills and 13.3% of state House bills are enacted on average compared with 3.6% and 1.9% of US Senate and House bills respectively.
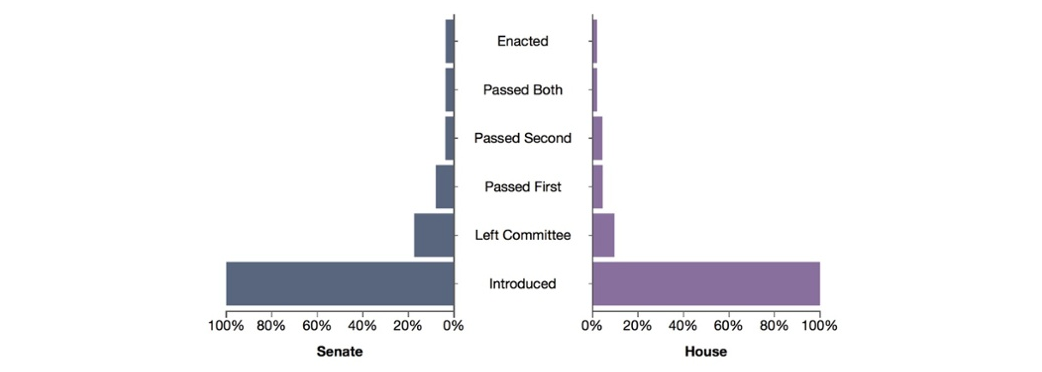
The number of bills introduced by state.

Legislation at the state level is more likely to be enacted than at the federal.

The Arkansas state legislature led in the percentage of enacted legislation.

During the first six months of 2016, 8,295 bills were enacted at the state level, which was 24% of the bills introduced across state legislatures. Arkansas led the way, enacting 94% of the bills introduced in its 2016 Fiscal Session.

These 10 states enacted the highest percentage of legislation in the first six months of 2016:

1: Arkansas – 94%

2: South Dakota – 56%

3: Colorado – 55%

4: Utah – 52%

5: Wyoming – 44%

6: Oregon – 40%

7: Nebraska – 38%

8: Tennessee – 37%

9: Virginia – 35%

10: Idaho – 31%