When it comes to proving your legislative affairs team’s ROI to agency leadership, there are a few best practices you can use to ensure you capture a full snapshot of your team’s hard work. See how you can quantify and qualify your legislative affairs work while streamlining your workflow in the process.
Evaluate and Report on Stakeholder Relationship Strength
Add stakeholder mapping to your legislative affairs strategy to gauge your legislative affairs success. At the beginning of the year, map all of your stakeholders to your legislative issues and categorize them as “champions,” “neutral,” or “detractors” of your legislative priorities.
At the end of the year, revisit this list and re-map which categories stakeholders fall under after engaging with them on your legislative issues. Measure how many stakeholders move up to a new category and use these metrics in your end-of-year reporting to score your team’s success at strengthening stakeholder relationships.
How many neutral stakeholders moved up and became champions of your issues? How did you work to reduce the number of detractors? Include these metrics in your ROI report to quantitatively support the summary of your team’s legislative affairs efforts.
| Category |
Beginning of 2020 |
End of 2020 |
| Champion | 53 | 145 |
| Neutral | 158 | 84 |
| Detractor | 42 | 24 |
Use a Data-Driven Meeting and Issue Tracker
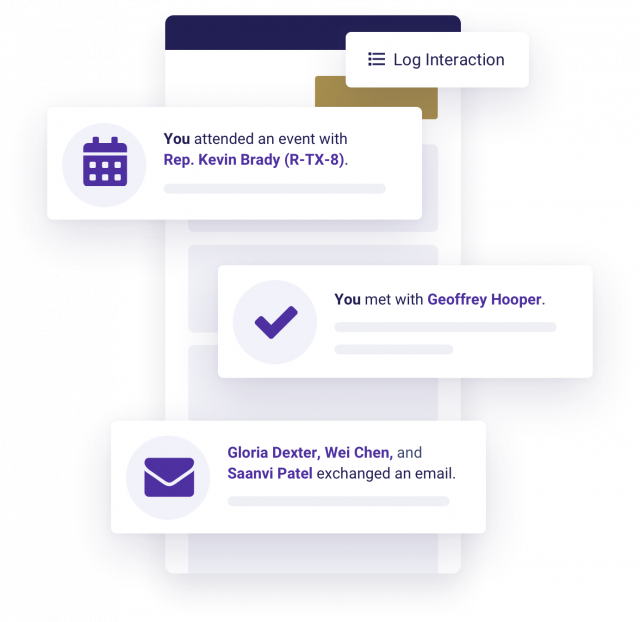
Use an interaction logger to help track your engagements with stakeholders, whether they be meetings, calls, emails, or unexpected run-ins. Meeting volume alone doesn’t necessarily prove value. The key is to track additional metrics for each meeting in your interaction logger so when building your reports, you can layer together these data points to dig deeper into what your meeting metrics mean:
- Issue – Note which issues in your portfolio you discussed in a given meeting
- Sentiments – After a meeting concludes, note the overall sentiment the meeting ended on. Was it positive or negative?
- Relationship Owner – Which members of your team participated in a given meeting?
 When building a report, look at how many meetings you had over the course of the year and how it aligns with the other data. Here are a few insights you can glean:
- If your legislative affairs work is successful, the volume of meetings that focus on a legislative issue should align with how much of a priority that issue is to your team. Did you have the most meetings on your top priority issue?
- Did your meetings have positive sentiments? If so, which issues did you generally find the most alignment on, or which team members led those meetings?
These correlations reflect how effective your relationship development efforts are. With this information, you can review and evaluate how effective your efforts were in a given period and update your strategies accordingly.
Measure the Correlation Between Your Legislative Affairs Team’s Effectiveness to Legislative Activity
Alongside tracking meetings, you should also track the legislative activity of the officials you meet with. This allows you to relate legislative happenings back to your agency’s engagement. The ideal correlation would show the more you meet with a legislator, the more they mention and publicly promote the issues you’ve discussed.
The best way to quickly pull this data is to build a spreadsheet that tracks your engagement alongside legislative activity. Make each row a different elected official your team met with. Add a column containing the number of times your agency engaged with a legislator’s office and a column listing the legislator’s activity volume. Legislative activity can be any desired key result from your legislative affairs work — sponsorships, votes, social media posts affirming your objective. Then, you can measure correlation using a scatterplot to identify trends in your legislative affairs work.
Look at which legislators are in the upper right corner — you engaged more and they participated in the conversation on your issue more. Then, look back at your interactions with those elected officials to reference the way you engaged. You can use the same strategy moving forward with other legislators to replicate your success.
Visualize Your Engagement Efforts with Quorum Dashboards
A dashboard operates as your central hub for legislative intelligence, allowing your team to visualize data in one place. Dashboards house the metrics your team needs to track all year long. This makes it easier to pull your metrics from one place when putting together an end-of-year report. Set up different widgets for KPI metrics you want to keep track of throughout the year.
Here are some visualization methods you can build into a dashboard that will help give a full picture of your legislative affairs efforts to agency leadership:
- Pie chart of percent of members of Congress your team has and has not engaged with: If there are any specific committees you are working with, break it down further with pie charts for members on each committee related to your issues.
- Live feed of interactions with legislators: This can be anything from emails, phone calls, to in-person meetings. This gives leadership a real-time view of the ground your team is covering when they check the dashboard.
- Bar chart of recent meetings with officials, color-coded by sentiment level: This helps you spot the average sentiments of your meetings. Are they mostly positive? Negative? What can you do to improve the sentiment level?
- List of the legislative activity of officials most active on your issues: If your legislative affairs efforts work effectively, the legislators you meet with the most will sponsor and talk about legislation related to your issues.
- Line chart of number of meetings over time: Color-code this chart by party or by issue to make sure you’re evenly distributing your resources to stakeholders in both parties across multiple issues.
- Number of interactions logged per team member: While quantity isn’t as important as quality, this number lets you see how each team member is using their time to cover ground
- Bar graph of volume of stakeholder social media dialogue: Use this chart to identify which stakeholders have the highest volume of social media posts mentioning your issues. If a legislator you meet and align on policy positions with posts frequently about their work on your issue, you can map them as a “champion” in your stakeholder mapping.
An auto-updating dashboard allows you to more quickly give updates to leadership on your team’s progress. Anytime leadership accesses the dashboard, they get the most up-to-date and easily accessible digest of your team’s impact.
From stakeholder mapping to logging interactions to legislative tracking, move your entire legislative affairs workflow into Quorum and build an end-of-year report that shows agency leadership a complete picture of just how much ROI they’ve gotten out of your legislative affairs team.