The immigration debate in Congress continues as House GOP leaders look to vote on a compromise bill next week, despite pushback from President Trump. On Thursday, 41 Republicans joined 190 Democrats to defeat the Securing America’s Future Act, a conservative bill that provided funding for President Trump’s wall and only temporary relief for DACA recipients. Here’s a data-driven look at the most Latinx populated congressional districts and what those 41 Republicans had in common:
Democrats represent 7 of the 10 most Latinx congressional districts.
The average Latinx population in a Democratic district is 23% compared to 12% in a Republican district. Six of the top ten most Latinx congressional districts border Mexico.

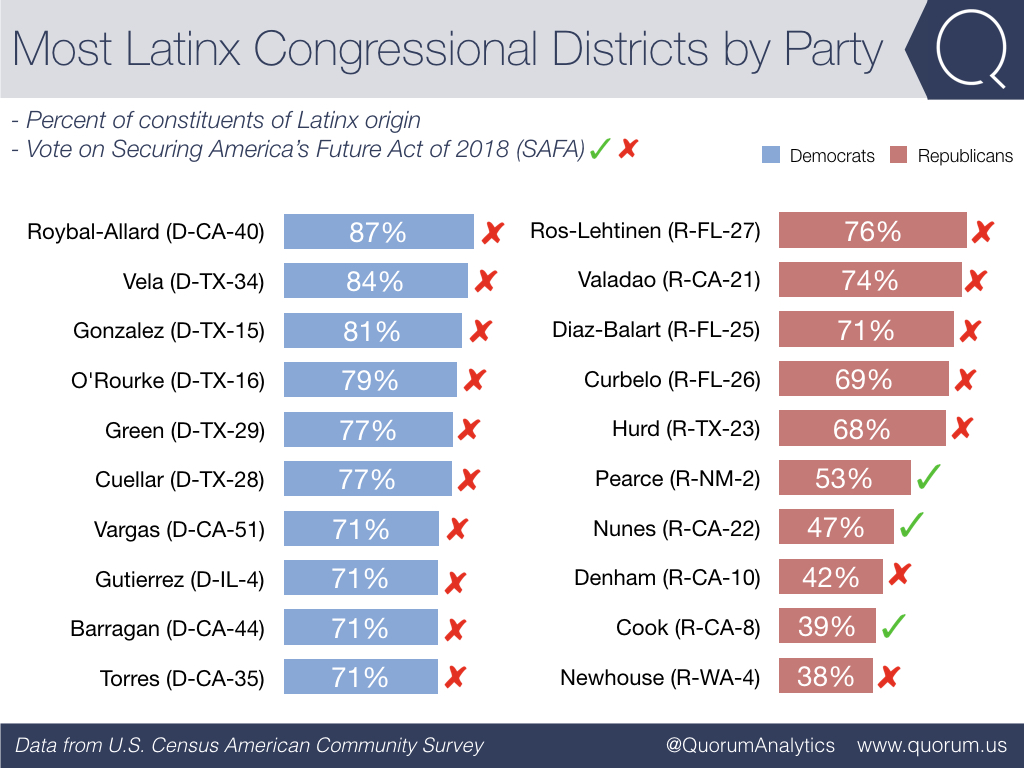
3 of the 10 Republicans who represent the most Latinx congressional districts voted in favor of SAFA.
Representatives Pearce (R-NM-2), Nunes (R-CA-22), and Cook (R-CA-8) all voted in favor of Thursday’s immigration bill. Rep. Pearce is the only member of the House with a majority Latinx district to vote in favor of SAFA.
Republicans who voted nay on the Securing America’s Future Act represent twice as many Latinx constituents as Republicans who voted yea.
The average Latinx population in districts where a Republican who voted against the bill is about 20%. Among the 193 Republicans who voted in favor of the bill, the average Latinx population sits at 10%.